

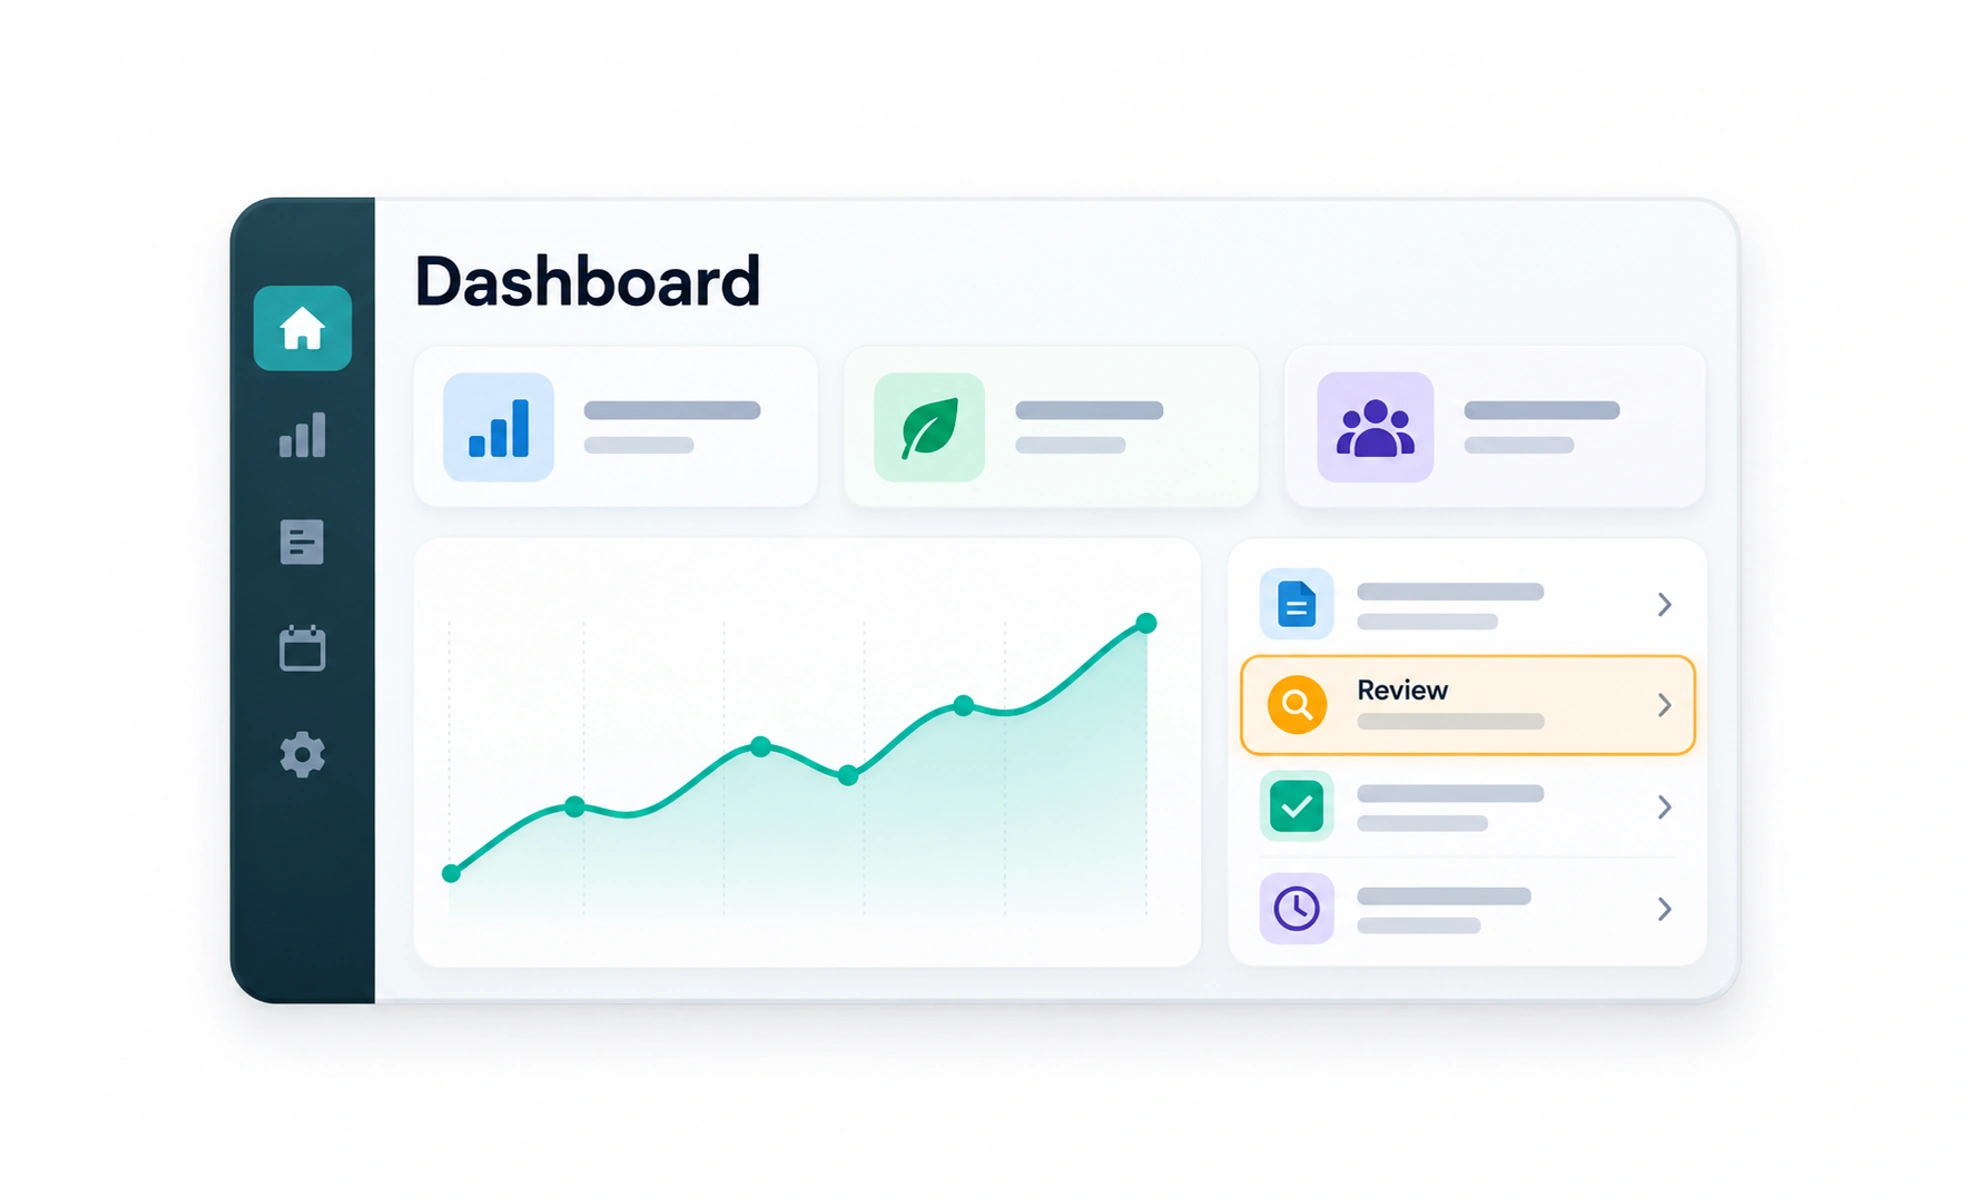
A dashboard brings together a focused set of information and actions that help someone monitor a situation or decide what to do next. Its value comes from relevance and clear relationships, not from filling the screen with charts and numbers.
It is like a vehicle’s instrument panel: each signal should help the person understand the state of the journey or choose an action.
Design around decisions
Identify who uses the dashboard, what they need to monitor and which decisions follow. Put the most important current information first and group related signals. A metric without context, target or next step often adds noise rather than insight.
Make data trustworthy
Label units, time ranges and definitions. Distinguish live values from delayed or estimated data, and provide an empty or error state when data is unavailable. Do not display sample values as if they describe the signed-in person or organization.
Show relationships without overload
Use charts when they reveal patterns that are difficult to see in a table or number. Keep comparisons on consistent scales and explain unusual changes. Offer a path to details for deeper analysis instead of cramming every record into the overview.
Example: learner home
A learner dashboard may show the active course, recently saved material and a real weekly learning summary. It should not invent a streak or use fixed progress values when the learner has no history. A clear empty state can recommend a first lesson and explain what will appear after activity begins.
Frequently asked questions
Key takeaways
- Start from the decisions the dashboard should support.
- Label data, time ranges and freshness.
- Never present placeholders as personal evidence.
- Use overview first and link to detailed analysis.