

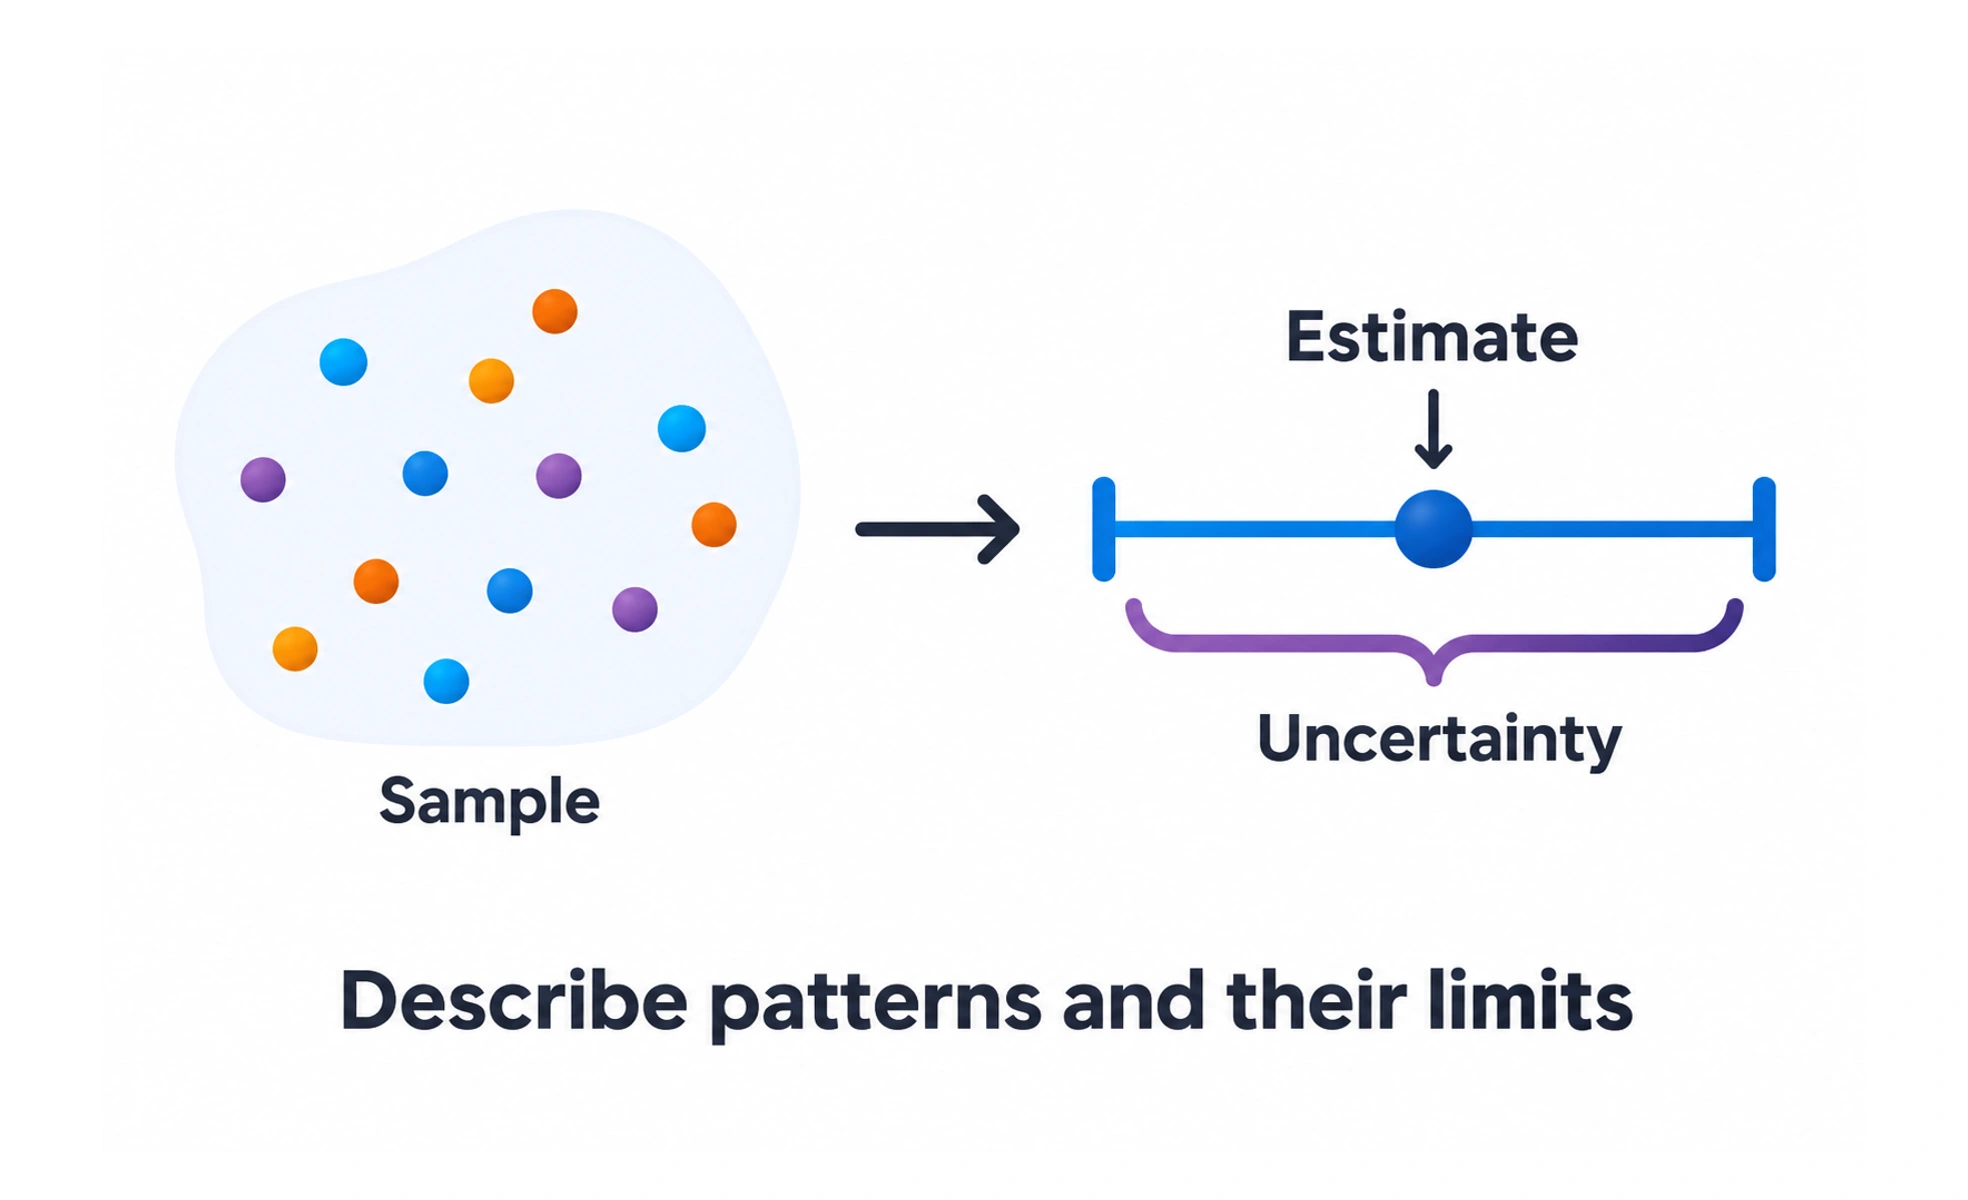
Statistical analysis uses data to describe patterns and evaluate uncertainty. It helps teams reason about observations while recognizing the limits of samples, measurements, and study design.
Tasting a spoonful can tell you something about a pot of soup, but the result depends on whether it was stirred and which part you sampled.
Begin with the question and data
Define what the team wants to learn and how the data was collected. Check missing values, repeated observations, and whether the sample represents the population of interest. A sophisticated calculation cannot repair a measurement that records the wrong event or excludes important groups.
Describe distributions appropriately
Look at counts, ranges, and the shape of the data before selecting a summary. The mean and median answer different questions, especially when a few extreme values are present. Segment when it serves the question, while avoiding tiny groups that create unstable conclusions or privacy risks.
Communicate uncertainty and causality
Sample estimates vary, and a reported difference may be uncertain or practically small. State the method and assumptions behind intervals or tests. Association does not establish causation; study design and plausible alternative explanations matter when claiming that a product change produced a result.
Example: testing a new lesson layout
A team comparing completion should define eligible learners, assignment, observation time, and the outcome before looking at results. It should report group sizes and the size and uncertainty of the difference. Repeatedly checking until a favorable result appears can mislead the decision.
Frequently asked questions
Key takeaways
- Match analysis to the question and collection method.
- Inspect data quality and distributions first.
- Report uncertainty and practical importance.
- Use an appropriate study design for causal claims.