

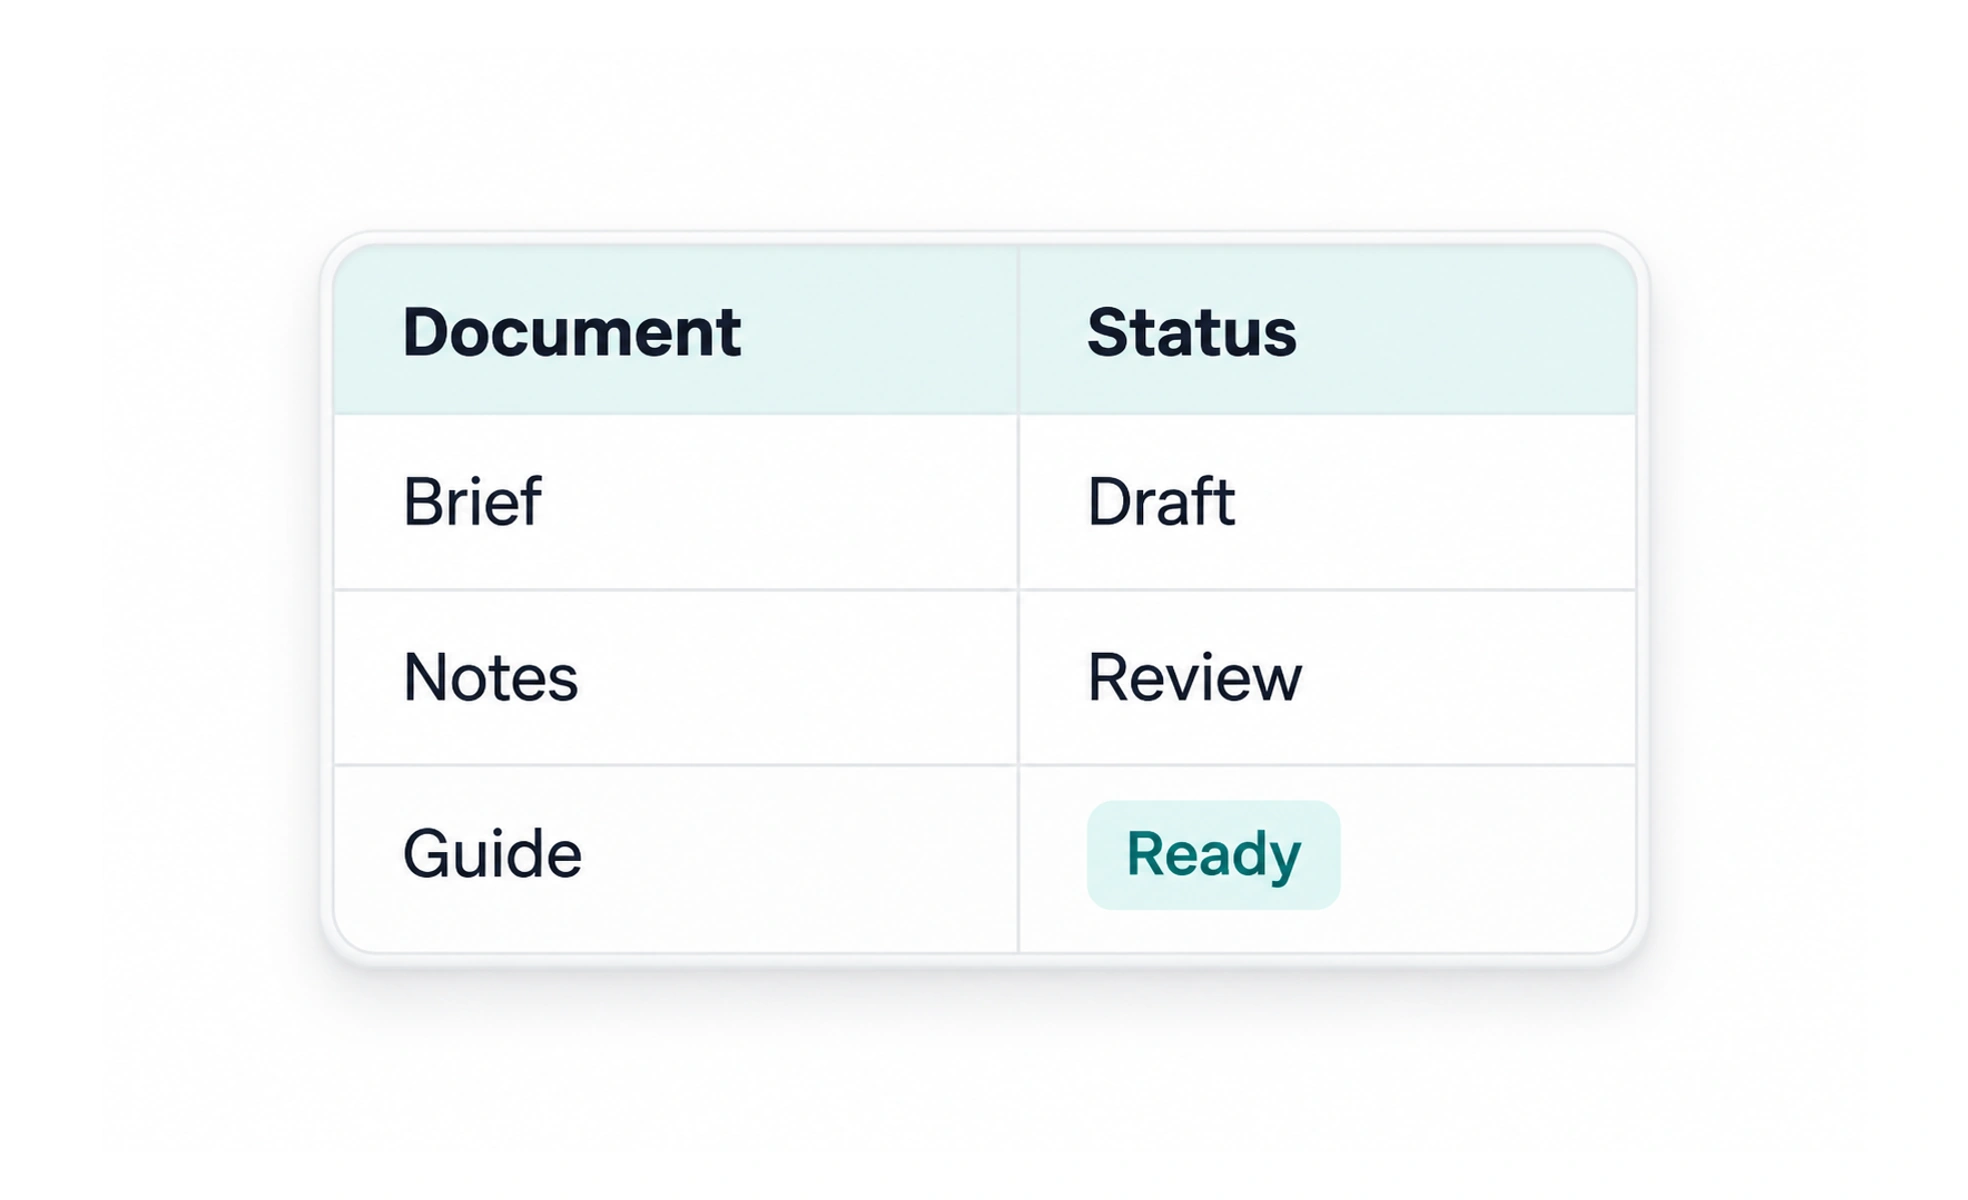
A table organizes related data into rows and columns so people can compare values across the same attributes. Tables are useful for structured information, but become difficult on small screens or when they contain too many columns and unexplained abbreviations.
A table is like a comparison grid: each column gives the same kind of fact for every row.
Use tables for relationships between values
Choose a table when people need to compare several attributes across records, such as a list of invoices with dates, amounts and payment states. If each item is mostly independent prose, a list may be easier to read. Do not turn a layout into a table just to align columns visually.
Make headers and values clear
Give columns descriptive headers and mark them as headers in the document structure. Use consistent units, formats and precision. Explain abbreviations and distinguish missing values from zero. Align numbers in a way that makes magnitude and decimal places easy to compare.
Plan for small screens and assistive technology
Keep the table semantically structured, provide a clear caption or nearby description and preserve header relationships. On a narrow screen, prioritize the columns needed for the task or provide a responsive alternative. Avoid shrinking text until the values can no longer be read.
Example: comparing course progress
An instructor compares learners by name, completed lessons and last activity. Those columns answer a specific monitoring task. A compact row action can open the learner record, while the table remains navigable with a screen reader. On a phone, show the name and completion first and let the instructor open a detail view for secondary fields.
Frequently asked questions
Key takeaways
- Use tables when column-to-row comparison matters.
- Provide meaningful headers, units and missing-value meaning.
- Preserve semantic structure on every screen size.
- Offer a task-focused mobile alternative when necessary.