

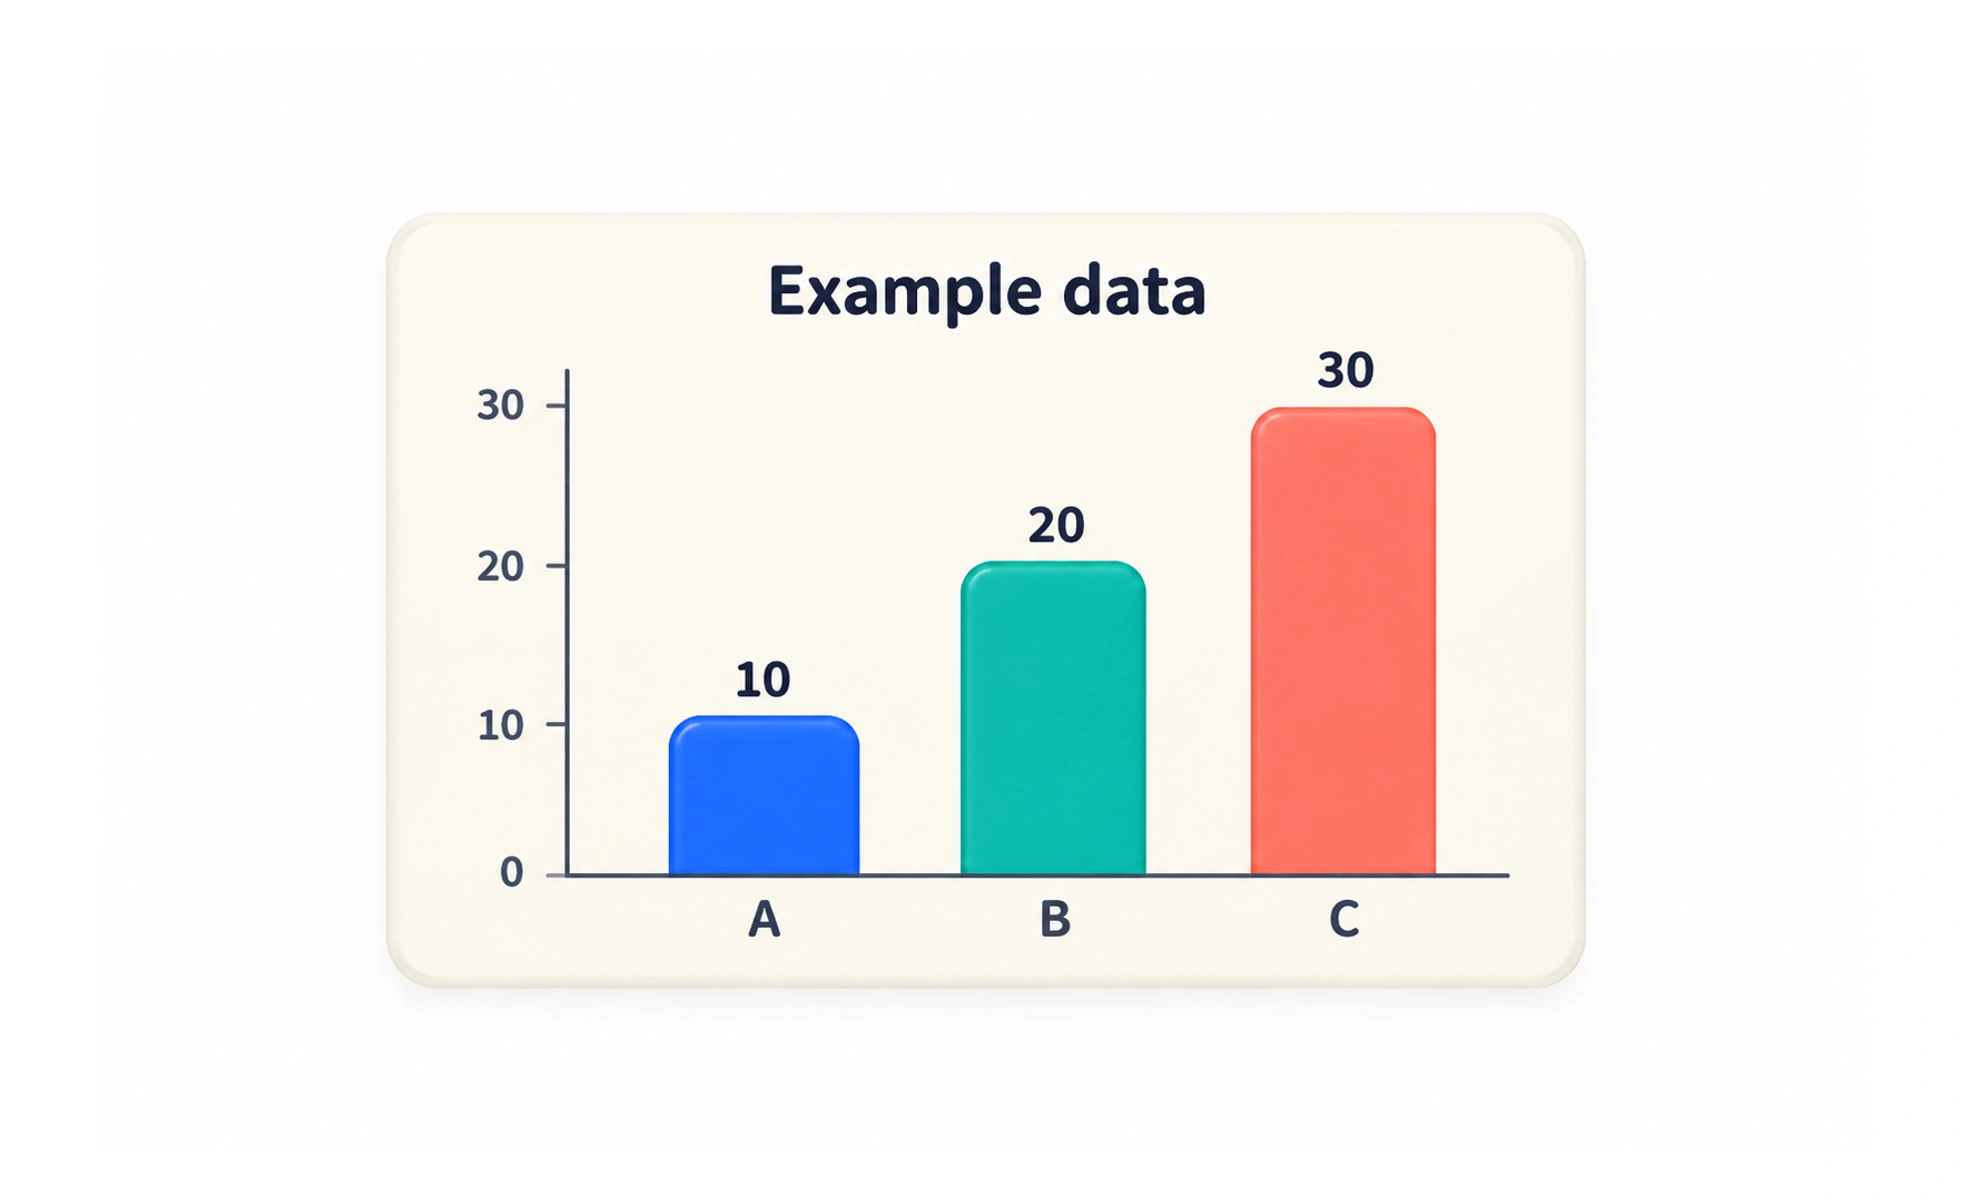
A chart is a visual representation of data that helps people compare values, notice patterns, or understand change. Its form, labels, and context should make the intended comparison accurate and easy to interpret.
A table of temperatures lists every reading; a line chart can make the rise and fall over a week easier to see. The chart helps only if its scale and labels tell the truth.
Match the chart to the question
Choose a visual form based on what a reader needs to compare. Bars are useful for comparing categories, while a line can show change across an ordered sequence. A chart should answer a specific question rather than decorate a page or imply a relationship the data cannot support.
Show scale, labels, and context
Name the measures, units, categories, and relevant time period. Use a scale that does not exaggerate small differences, and identify missing or estimated values. A title should say what the data describe, while a source or note can explain collection methods and important limits.
Make the data accessible
Do not rely on color alone to distinguish a series; combine color with labels, patterns, or shapes where useful. Check contrast, keyboard access for interactive controls, and legibility at small sizes. Provide a concise text summary and a data table or equivalent when the chart conveys information that is not available elsewhere.
Example: comparing completion rates
A bar chart can compare completion rates for several courses if each rate uses the same definition and population. Show the denominator or sample size when it affects interpretation, and state the date range. If learners need exact values, include them in labels or a table instead of asking them to estimate from bar height.
Frequently asked questions
Key takeaways
- Choose a chart to answer a clear comparison question.
- Label measures, units, scale, and relevant context.
- Use accessible encoding and provide an equivalent text or data view.
- Do not imply conclusions the underlying data cannot support.