

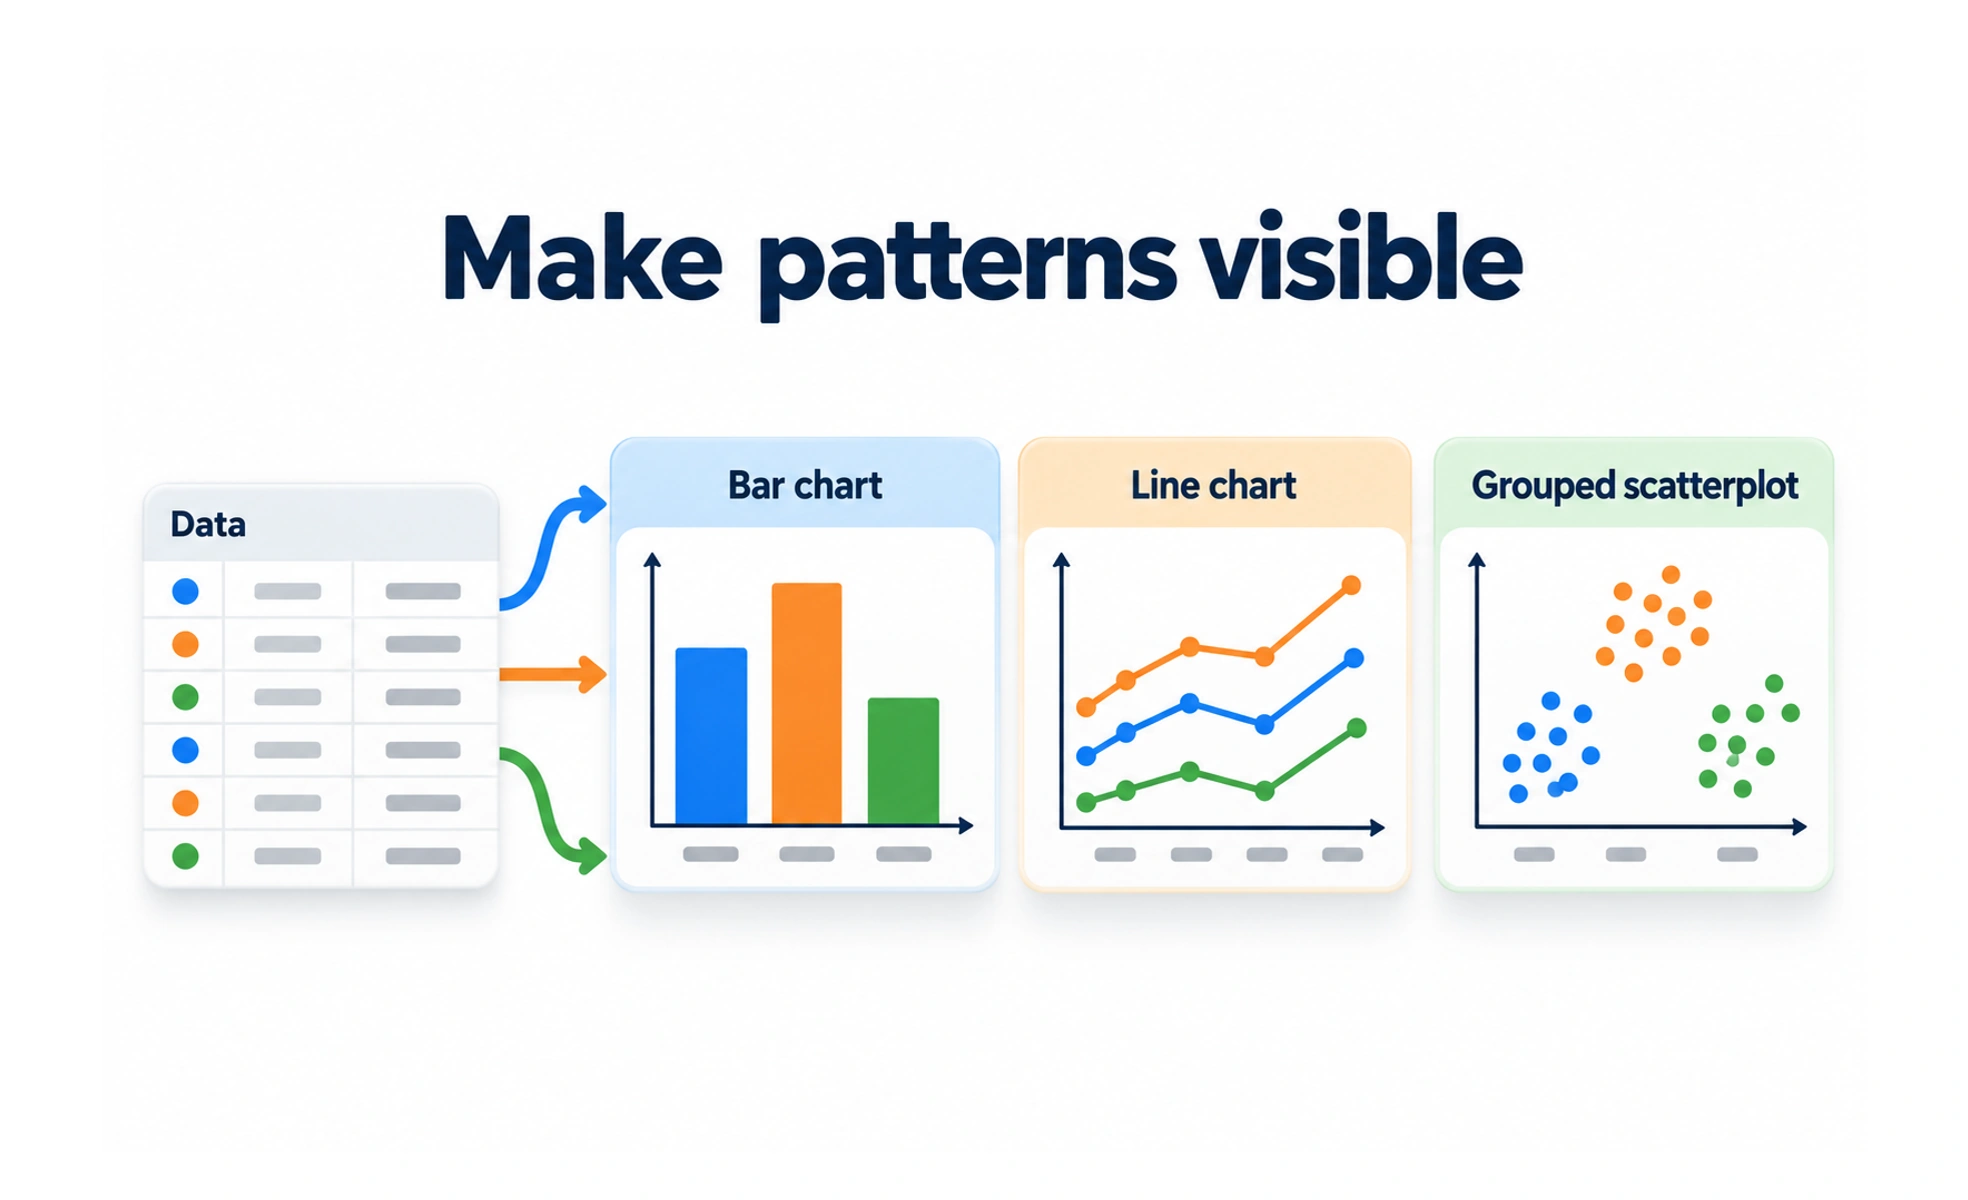
By translating raw metrics into visual patterns, it allows users to grasp trends, outliers and correlations instantly. Effective charts balance statistical integrity with clean visual aesthetics.
Think of it as a weather radar map. Instead of reading a confusing spreadsheet of wind speeds and barometric numbers, a glance at the color radar shows you where the storm is headed.
Types
Data visualization employs distinct chart archetypes tailored to specific data structures and analytical goals.
- Bar charts excel at comparing discrete categorical quantities side by side along a common baseline.
- Line charts illustrate continuous trends, fluctuations and progress over chronological time intervals.
- Scatter plots reveal mathematical relationships, distributions and clustering between two continuous variables.
- Heatmaps display data density and activity variations across two-dimensional grid coordinates using color saturation.
When to use it
Deploy data visualizations whenever users must analyze metrics to make informed decisions.
- Product analytics dashboards show active user growth cohorts, churn rates and funnel drop-offs at a glance.
- Financial reporting tools present revenue trends, budget breakdowns and expense trajectories clearly to executives.
- Skill assessment graphs visualize learner competency proficiencies across diverse curriculum areas.
- Performance monitoring consoles alert server engineers immediately when traffic spikes exceed normal thresholds.
Common mistakes
Designers frequently create misleading or unreadable charts by prioritizing visual novelty over clarity.
- Truncating chart y-axes, which artificially exaggerates minor differences and misleads viewers.
- Using 3D chart projections, distorting perspective and making precise value comparisons impossible.
- Overcrowding charts with too many lines, creating an indecipherable spaghetti mess of conflicting colors.
Frequently asked questions
Key takeaways
- Data visualization transforms raw numbers into intuitive visual patterns and relationships.
- Select chart types based on the analytical question: bar for comparison, line for trends, scatter for correlation.
- Always start bar chart baseline axes at zero to prevent accidental visual distortion of quantities.
- Ensure charts remain readable for colorblind users by combining distinct hues with shape markers.