

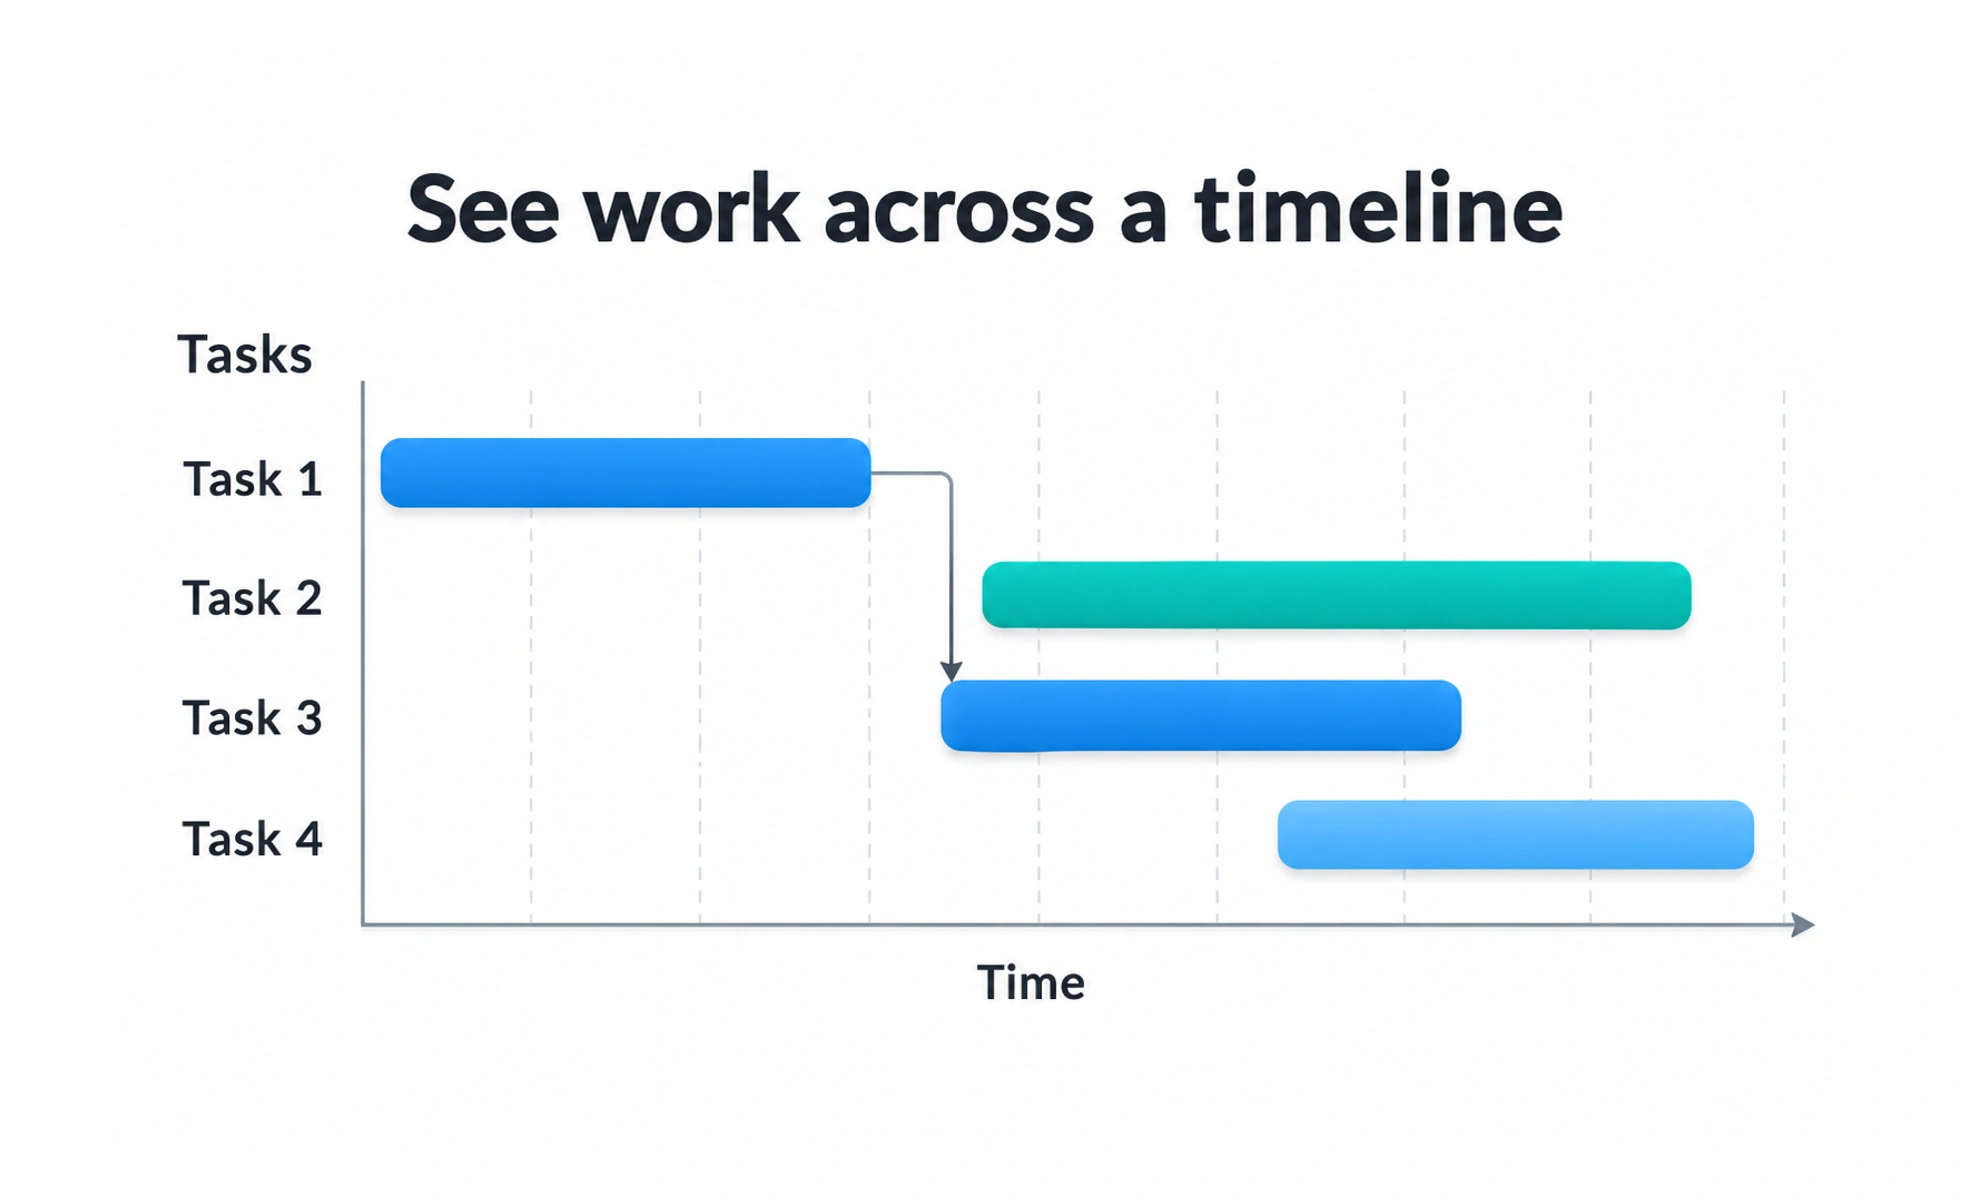
Project teams use a Gantt chart to discuss sequencing, ownership, dependencies, and expected timing. It can make a plan easier to inspect, but a polished timeline is still an estimate. Keep it connected to current work and make uncertainty visible rather than treating planned dates as guarantees.
It resembles a calendar stretched across a project: each bar shows when a piece of work is expected to occupy time.
Represent work over time
List tasks or workstreams against a shared timeline, with each bar showing a planned start and finish. Use milestones to mark significant events such as a review or release. Keep the level of detail appropriate for the decisions people need to make.
Show dependencies and ownership
A task may depend on another task finishing first. Indicate important dependencies and name an accountable owner so schedule risks can be discussed. Avoid implying that a visual link guarantees delivery; teams still need to confirm assumptions and coordinate changes.
Represent uncertainty honestly
Estimates change as teams learn more. Distinguish target dates from commitments and show blocked or at-risk work with clear labels, not color alone. An exact-looking chart can create false confidence when task scope, staffing, or external approvals remain uncertain.
Keep the plan useful
Update the chart when plans or dependencies change, and note when it was last reviewed. If a project has many parallel streams, provide filters or a higher-level summary. Pair the timeline with outcome measures so the team tracks delivered value as well as dates.
Frequently asked questions
Key takeaways
- Use timeline bars to show planned task duration and milestones.
- Make important dependencies and owners visible.
- Label estimates and risks instead of presenting uncertain dates as facts.
- Keep the chart current and connected to project outcomes.