

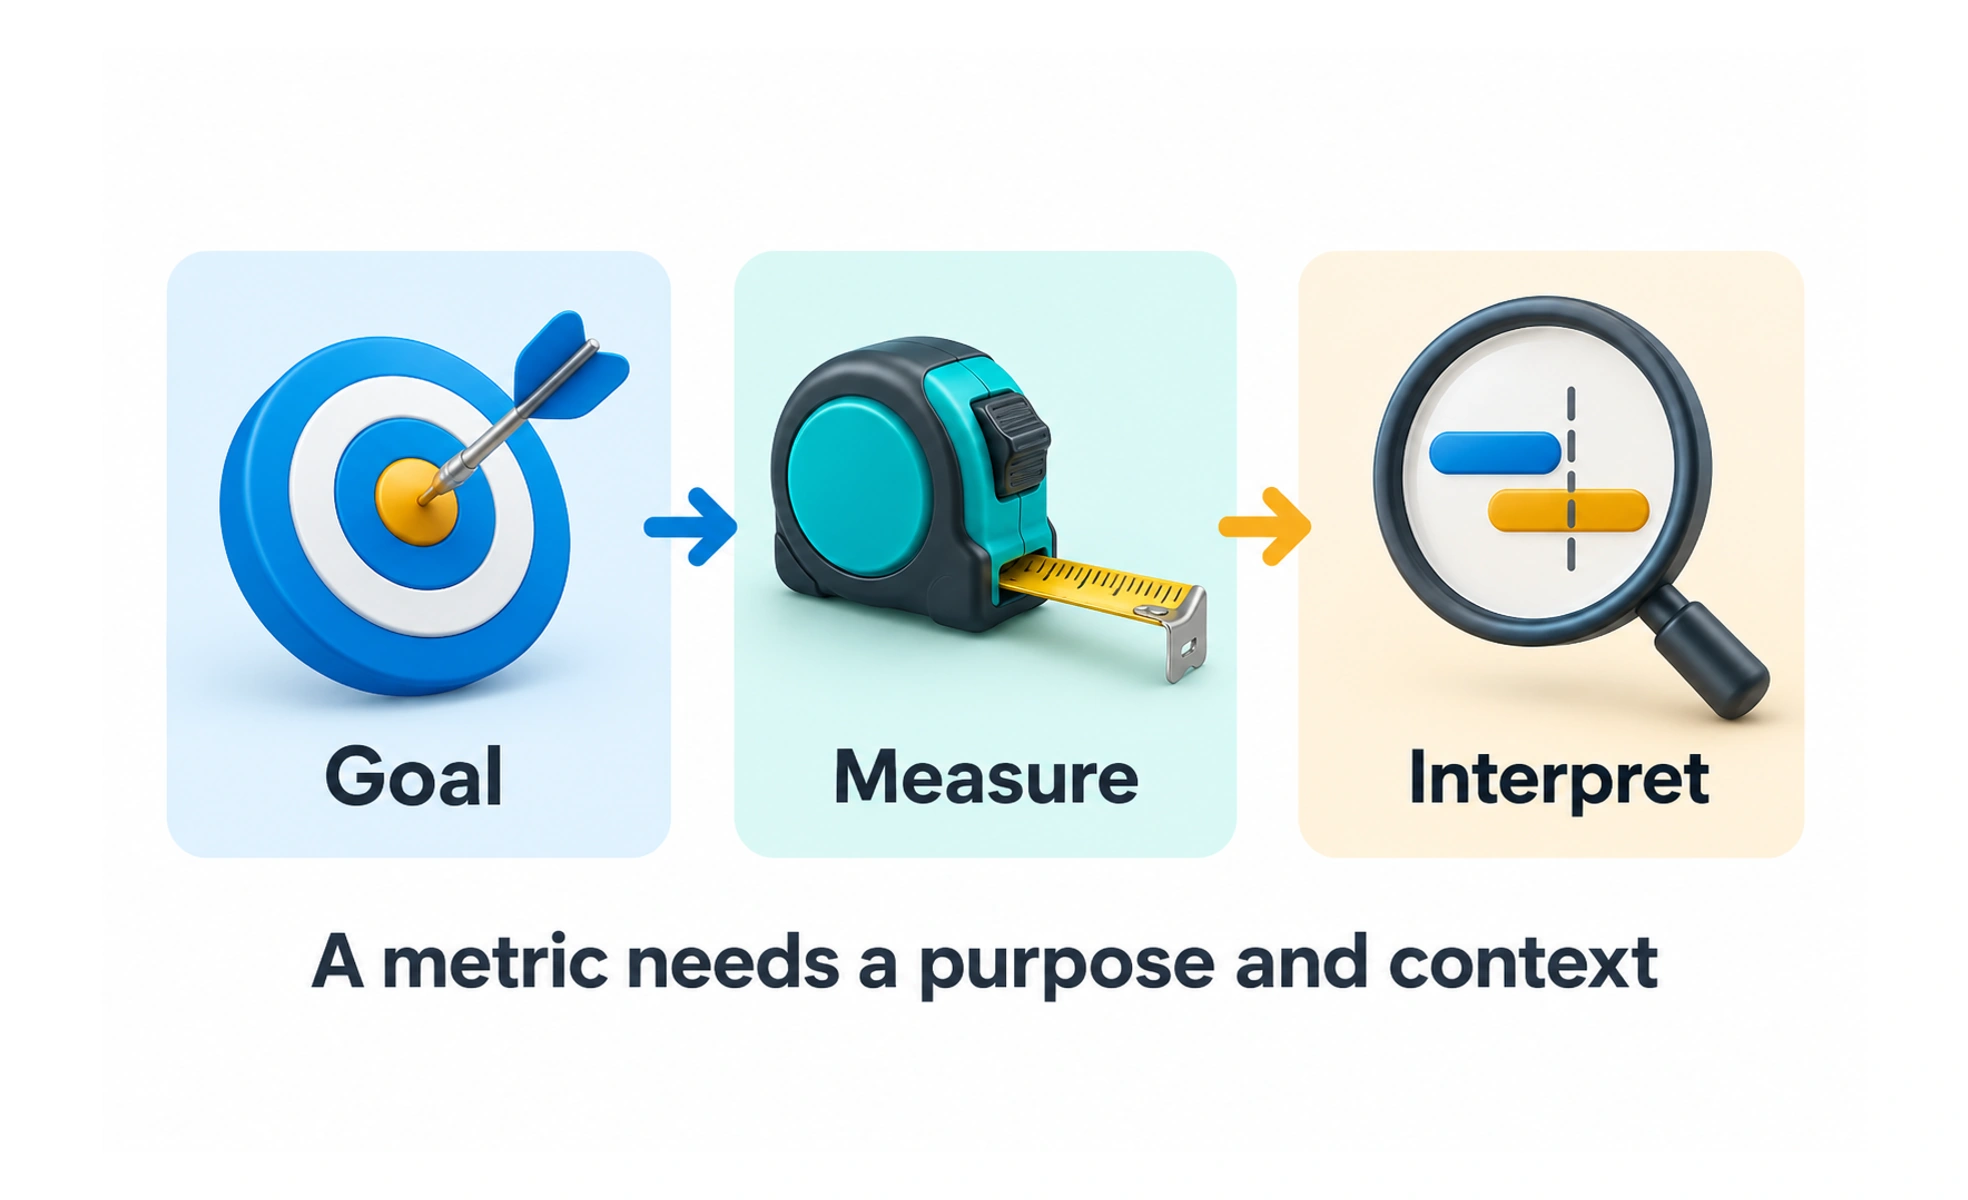
Performance metrics are measurements used to evaluate how a product, process, or service is working. They become useful when connected to a clear goal and interpreted with context.
A car dashboard shows speed, fuel, and temperature because each answers a different question. A product dashboard also needs a small set of purposeful signals.
Start with a decision
Ask what the team needs to understand or change before choosing a measurement. A metric might describe response time, completion, reliability, or customer behavior. Define the goal and the action a change in the number could prompt so the dashboard supports real decisions.
Define the measurement precisely
Record the event or quantity, eligible population, time window, and calculation. State how missing data, repeated events, and unusual cases are treated. Two teams can use the same metric name while measuring different behavior, making their results difficult to compare.
Look at distributions and guardrails
An average can hide a small group having a very poor experience. Review relevant segments and the distribution where appropriate. Pair the target metric with checks for unwanted consequences, such as faster replies that increase repeat support contacts or higher conversion that increases cancellations.
Example: lesson loading
A team investigating slow lessons can measure the time until meaningful content becomes usable and compare devices and network conditions. It should also check load failures. A quick response from the server alone may not describe what a learner experiences while media and interactive controls are still loading.
Frequently asked questions
Key takeaways
- Choose measurements that support a decision.
- Document definitions, populations, and time windows.
- Inspect relevant segments and distributions.
- Use guardrails to detect unintended effects.